Represent Multiple Database Stats on Heat Map/ Choropleth Map
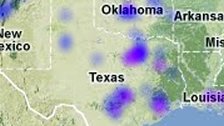
Heat Maps or Choropleth Maps are a thematic maps for geographical representation of statistics by dots or by areas. Heat Map uses a color progression or gradients to depict data per area. Data source usually come from databases or even Excel files.


